We’ve been working in some row intervals lately, which will culminate in a 2k max effort time trial in the very near future. This has prompted some questions from members lately about how to best improve their row. So in this article, we’re going to talk all about rowing.
The Concept 2 Row Ergometer is a machine that rewards efficiency of movement, and punishes inefficiency. My first ever class WOD at Viking Athletics (then only known as CrossFit Relentless) saw me next to a 6’1” woman. The WOD: 500m row, 500m ski, 500m row. I was 23 and had an engine, but despite cranking away on the rower and pouring as much effort into it as I could, she smoked me on the rows. Sure, it turned out that she was a former collegiate rower, but that serves to illustrate the point – she was able to get much more output with less input that I was giving. In other words, she was much more efficient.
To become an efficient rower, it’s important to have solid stroke mechanics, and above all, to be consistent with them in terms of form and cycle time. Fortunately, the PM5 monitor attached to the row erg has several tools to help you learn to pace, and to give you feedback on your efficiency. So, first things first, we’re going to explain the numbers on the screen (and the damper).
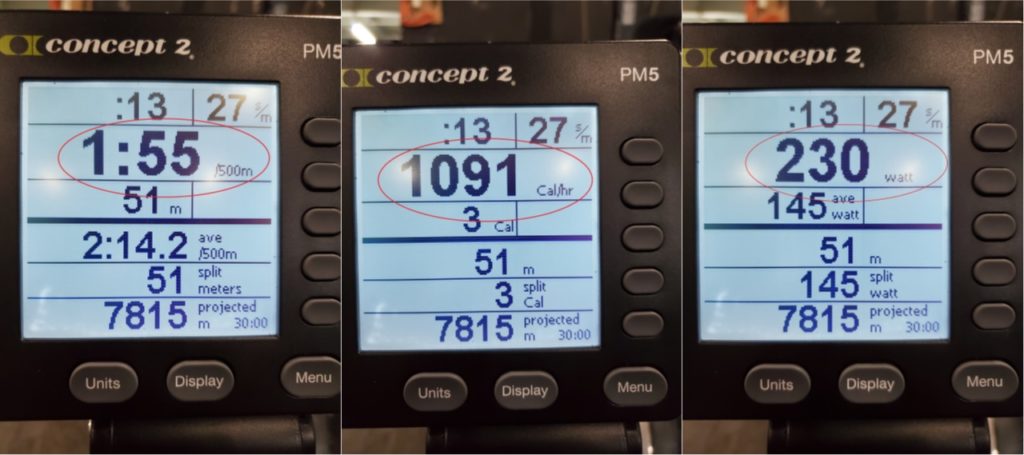
Power per stroke – This is the biggest number on your screen, and it shows the power of each individual stroke. If it drops over time, you’ve fatigued and are no longer maintaining a consistent output. Its unit of measure will depend on what unit you’re using in your WOD. If you’re rowing for meters, your power per stroke is in mins/500m. If you’re rowing for calories it’s Cal/hr. Or, you can just use Watts. When coaches are pushing you through a WOD, this is the first number we want you to notice, because it’s a great indicator of your fatigue level. As your abilities progress, you’ll learn what types of outputs you can maintain over various time domains. Furthermore, your output will change based on your effort level, and the damper setting.
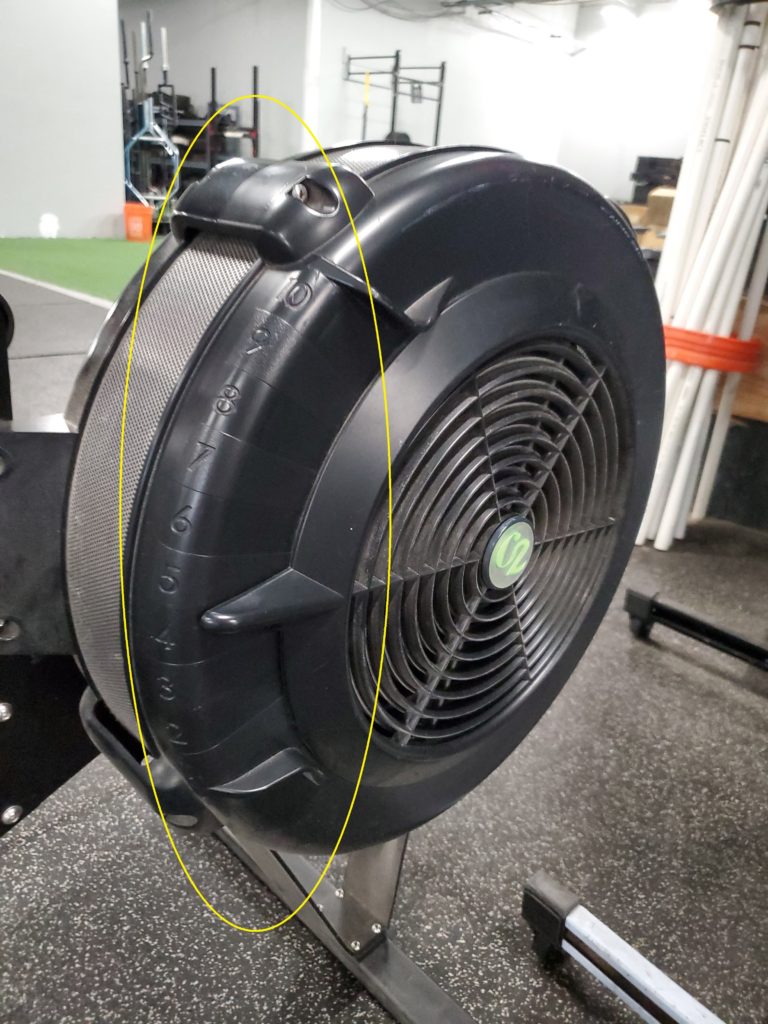
Damper setting – The row erg is not only a standalone piece of equipment; it’s also used for crew rowers when they can’t get on the water, or to help them develop as athletes. As such, the rower is calibrated so that at a damper setting of 4.5 (in between the 4 and 5), a 175 lbs male would have the same resistance as rowing in water. That’s not what we’re training for, so we don’t really care what water resistance feels like. (As an aside, if you do want to mimic the feel of water, look up “drag factor” and you can use the test built in to the PM5 monitor to measure yours. This will give you the damper setting that mimics water for you). What we care about is which setting will give you the most power over time. I equate the damper to gears on a bike – if you’re in a higher gear, you feel more resistance to start, but if you can get moving and keep moving, you cover more ground with less pedaling. The same is true for damper settings on the rower – the higher the setting, the greater the resistance. But, if you’re powerful enough to keep moving at a decent stroke rate (see below) without burning out (see power per stroke), you’ll be more efficient in the long run.
Stroke rate – Measured in strokes per minute, this is how quickly you’re cycling your strokes. This number will be different for everyone based on height, and the goal of the workout. When doing short, all out sprints, we expect this number to be higher than it would be for a longer distance row. Furthermore, shorter athletes have less distance to travel when rowing, so we expect their rate to be consistently higher than taller athletes.

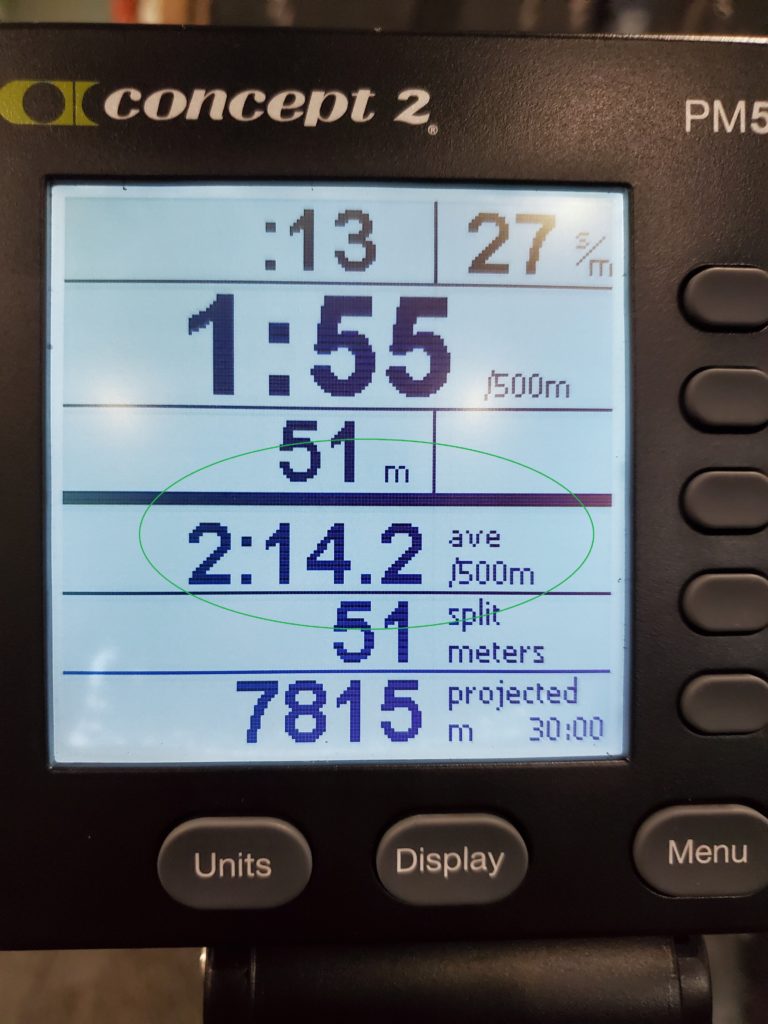
Avg Pace – This only appears when rowing for meters. When rowing for other units, this bar becomes your meter count. Your average pace is in units of time/500m, and it’s based on your average power per stroke, as well as your stroke rate. It’s possible to achieve the same time per 500m with fewer, powerful strokes, or with faster, weaker strokes. It’s the average.
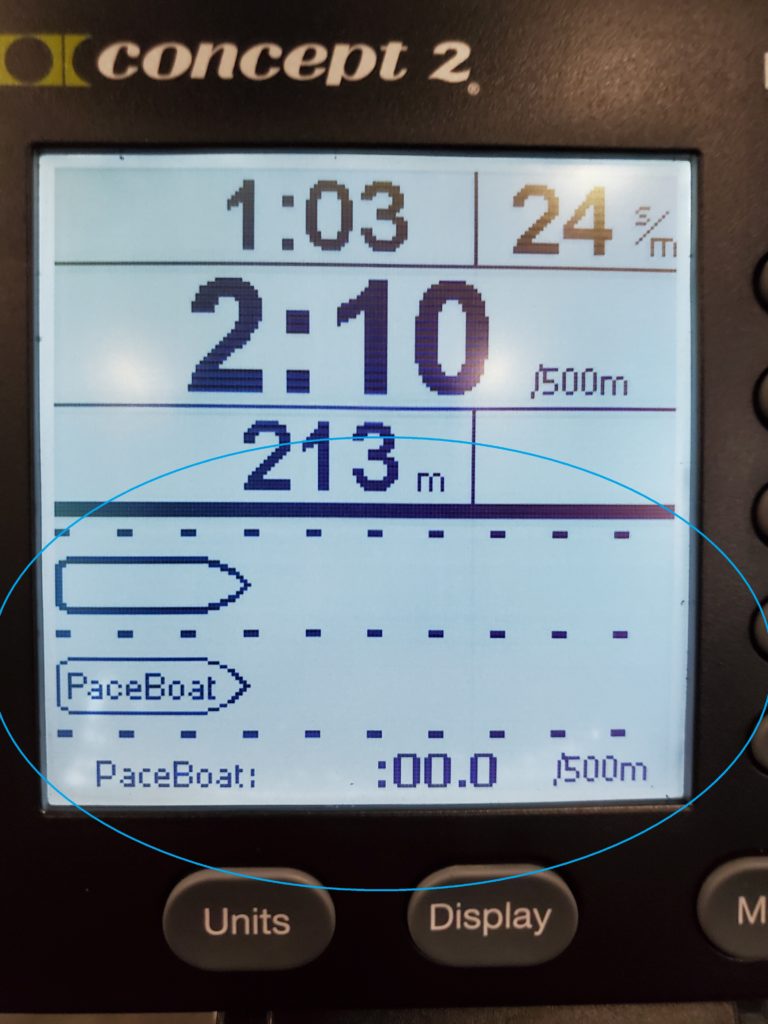
Pace Boat – This feature is useful if you have a goal pace in mind. If you don’t like numbers and don’t want to worry about your stroke rate or power per stroke, you can turn the row into a game, where all you need to do is stay ahead of the pace boat. Just beware that the pace for the boat is ALWAYS a pace for 500m. If you’re rowing a longer distance, make sure you do your conversions first. Otherwise, it will do you no good.
Power Graph – This feature is very useful for diagnosing what’s going on with your stroke. We’re going to delve into some examples below, but first we want to cover what proper technique looks like.
Proper technique – A sumo deadlift high pull is a useful movement for comparison when it comes to rowing. When we set up, our arms are extended, our knees are bent, and our backs are straight. From there, we initiate the pull with a powerful leg drive, then we extend the hips, and follow through with an upper body pull. To recover, we extend the arms FIRST, then close the hips, and then bend the legs IN THAT ORDER. Your arms and legs should never be bent at the same time. Additionally, the recovery (way back in) should take about twice as long as the pull. The video below shows proper technique.
Some common flaws that are immediately obvious when watching athletes row include leaning too far back during the pull, and failing to extend the arms first during the recovery. See the video below for both.
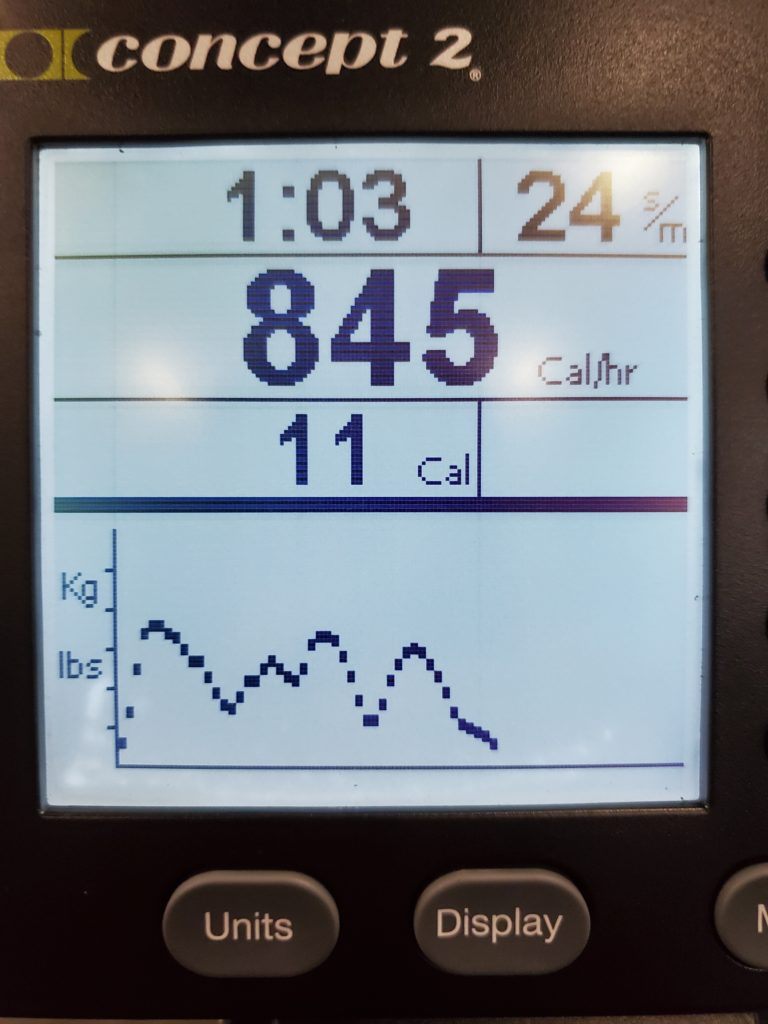
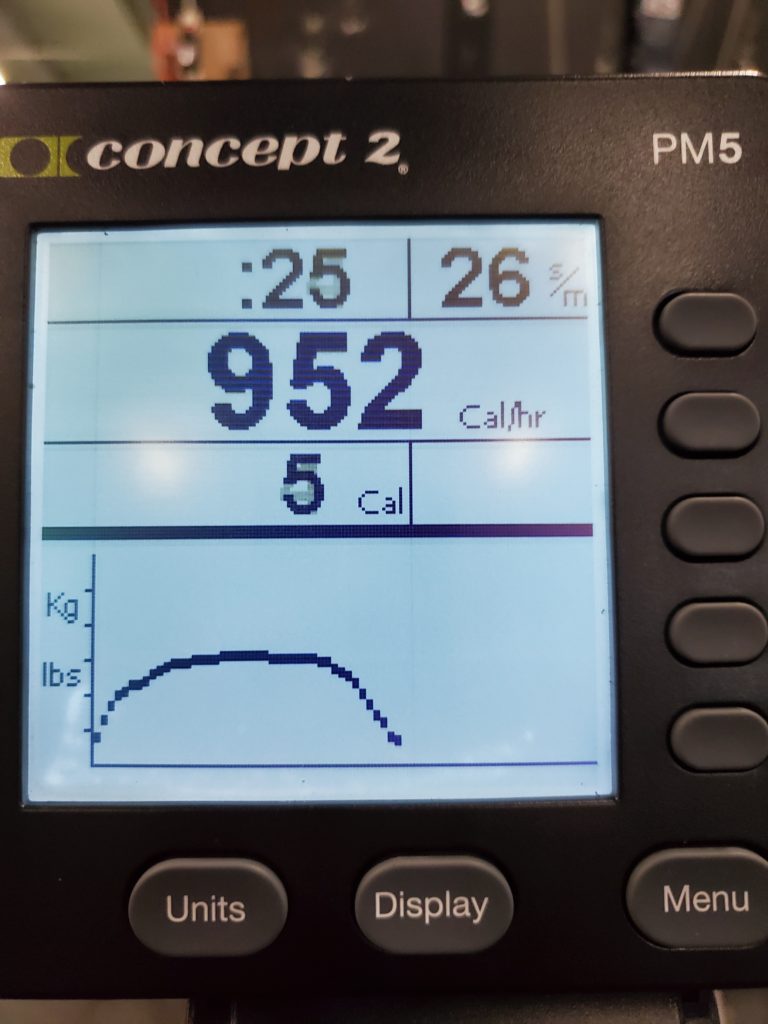
Now we can return to the power graph mentioned above. If we have proper rowing technique, our graph should be a nice, smooth, dome shaped curve as shown below. The bigger and longer it is, the more powerful and longer your stroke is. This will vary from athlete to athlete depending on height, weight, and power, but the general shape should always be the same.
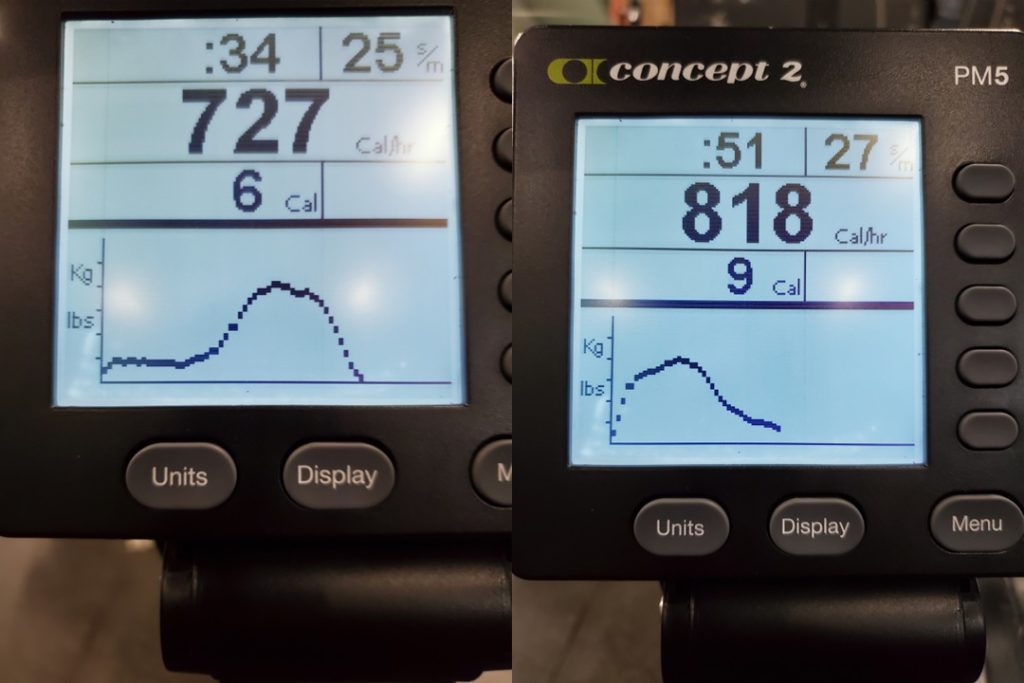
Some rowing faults are not always visible to the eye, because the stroke may look smooth. However, the power graph can show us what’s really happening. If you look at the two graphs below, one has a delayed peak, and the other peaks early and then diminishes. In the first one, the athlete has no leg drive and relies entirely on the arms. Given that the proper movement sequence ends with the upper body, it makes sense that the peak is delayed. In the second, the athlete has a big leg drive, but no finish with the upper body, hence the early peak and subsequent degeneration.
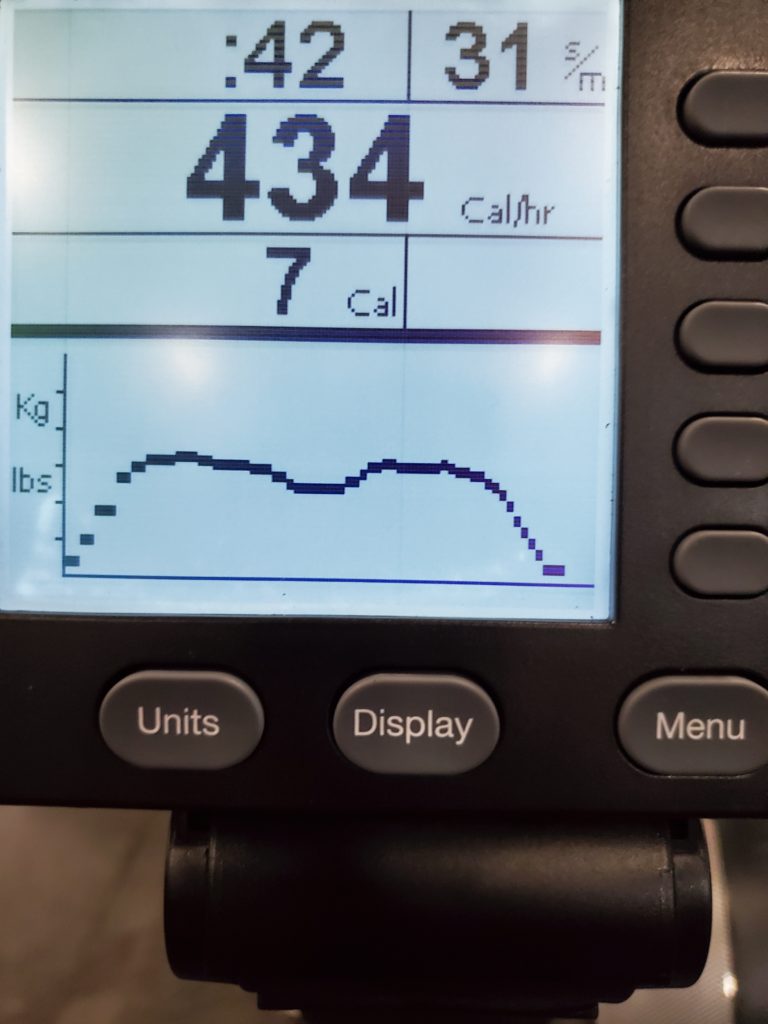
Another common fault is extending the hips too early during the leg drive. When this happens, the athlete kills the power transfer from lower to upper body, resulting in 2 separate peaks, as shown below. Again, it can be difficult to see this when watching videos of yourself rowing, so the power graph is immensely helpful here.
At the end of the day, if you pay attention to your numbers, you can become very proficient with pacing, and a very efficient rower. It’s much easier to gauge this on a rower than when running, because you have a monitor right in front of you giving you all kinds of information. If you want to improve to your highest possible level, it’s important to internalize this and adjust your numbers based on the type of workout you’re performing. And as always, be sure to talk strategy with your coach before rowing. See you in the gym.